Metrics
Definition
Metric records the execution time of a task, workflow, form or set of tasks associated with some complementary data.
Metric template
Metric template is a metric calculation model in which we can define the main value label et and the Second value label. To create a metric template, simply click on the Configure menu of Pulse-IT Menu and Select Metric templates.
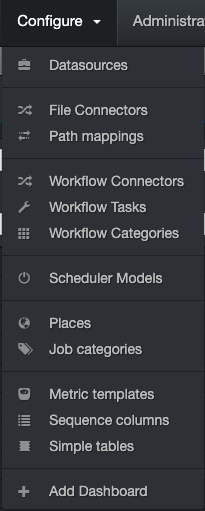
You can add a template by clicking on the button "Add" and fill out the form

Template name
Set the name you would like to give to the template.
Keep value for
Put the time that you want to keep metric values. Collected metrics will automatically be deleted after this period of time.
Main value label
In addition to the execution time, you can store a main value label which can be strings (eg : kind of movies), or numbers ( eg: duration of movie), and
its value will then be used for graphs.
Second value label
You can also store a second value label which can be strings (eg : kind of movies), or numbers ( eg: duration of movie) and
its value can then be used for graphs.
Metric Creation
Metric task
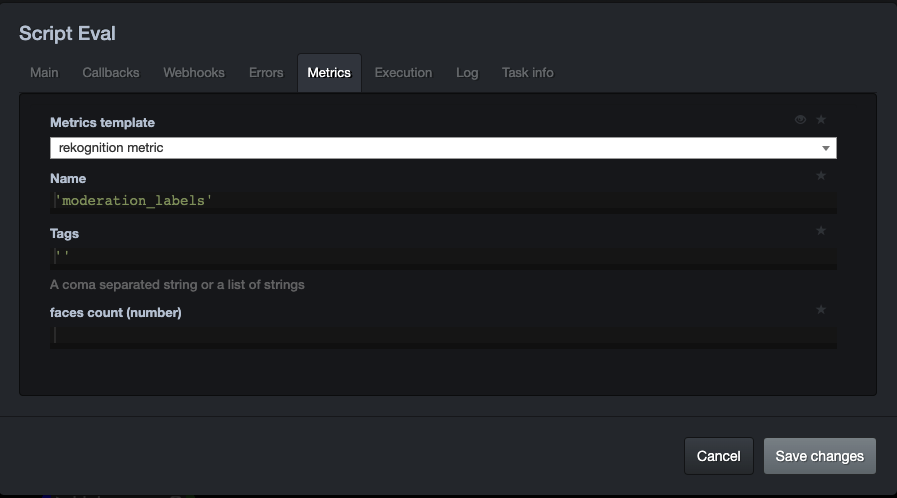
In any Pulse-IT task, there is a metrics tab. So, to estimate the time to execute a task, click on the Metric tab of the task. Afterward, we set the parameters Metrics template, Name and Tags.
Metric workflow
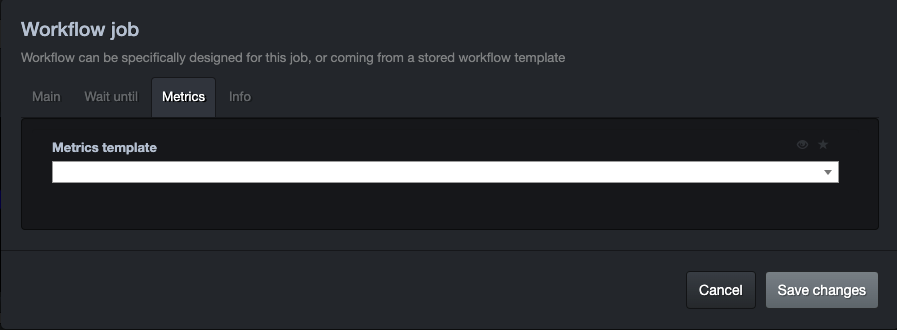
In any Pulse-IT workflow, there is a metrics tab. So, to estimate the time to execute a workflow, click on the Metric tab of the workflow. Afterward, we set the parameters like Metrics template, Name and Tags.
Metric form
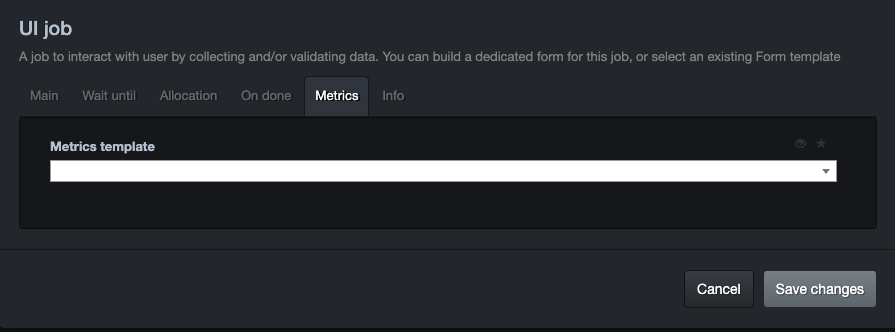
In any Pulse-IT form, there is a metrics tab. So, to estimate the form time execution since the setting up of the form to the end of its execution, click on the Metric tab of the form. Afterward, we set the parameter Metrics template, Name, Tags, main value label and Second value label.
Group of tasks metric
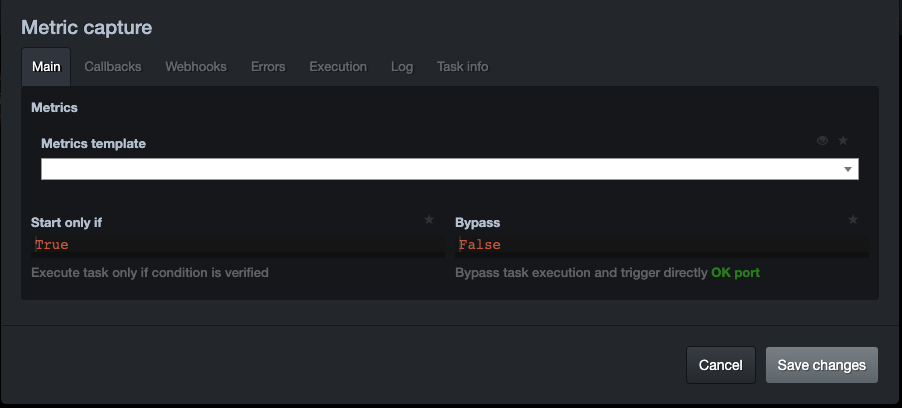
It is also possible to determine the execution time of a group of tasks. Simply connect the groups of task in the yellow port of the capture metric task.

In the metrics tab of metric capture task, set the parameters Metrics template, Name and Tags.
Metric visualization
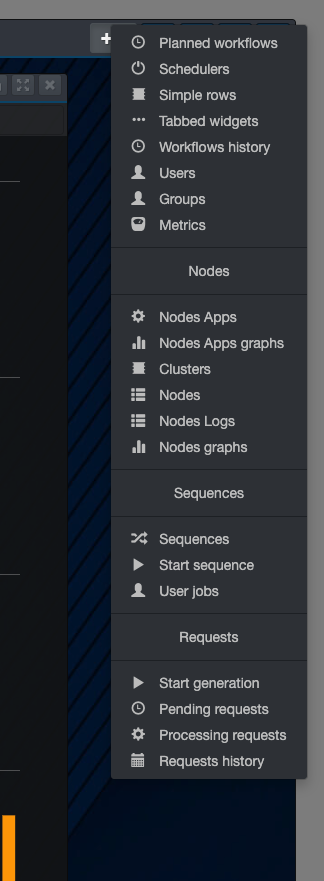
To visualize metric, first create a dashboard and then press on + to add metrics in our dashboard.
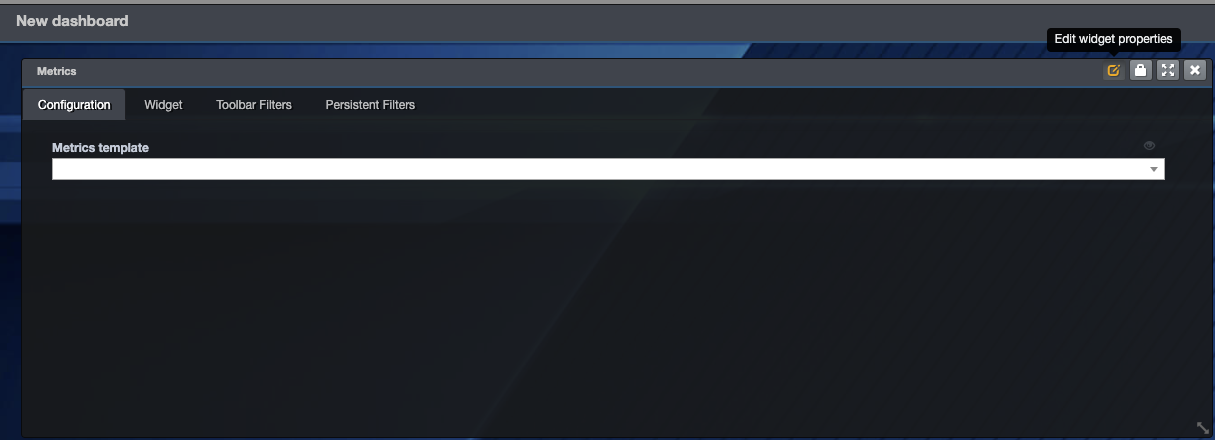
Next, click on "edit widget properties" and choose the metric template to visualize, and it's done.
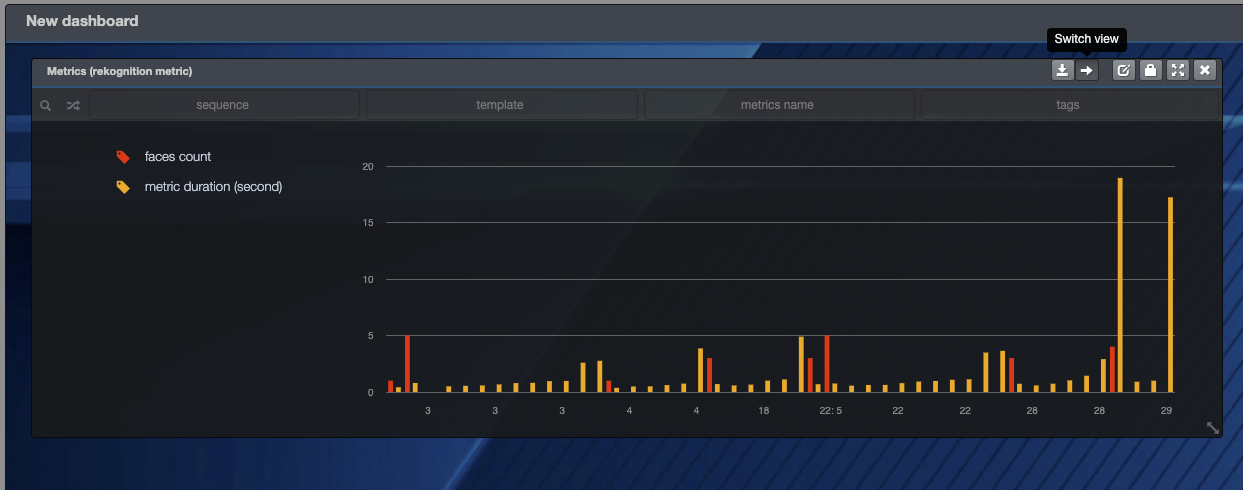
 Furthermore, it's possible to choose the way to present the metrics (either in table, diagram or ...) by clicking on the
tab "switch view"
Metric export
Metric data is exported in csv file by clicking on the button "export row data".

Sample export in csv. Main value label and second value label are displayed column F and G.
