Monitoring Pulse-IT/Automate-IT system with Grafana
Goal
Our goal is to make a Grafana dashboard capable of monitoring the Pulse-IT/Automate-IT system so that you can monitor it from a centralized dashboard where you might want to monitor other systems you use.
Audit events

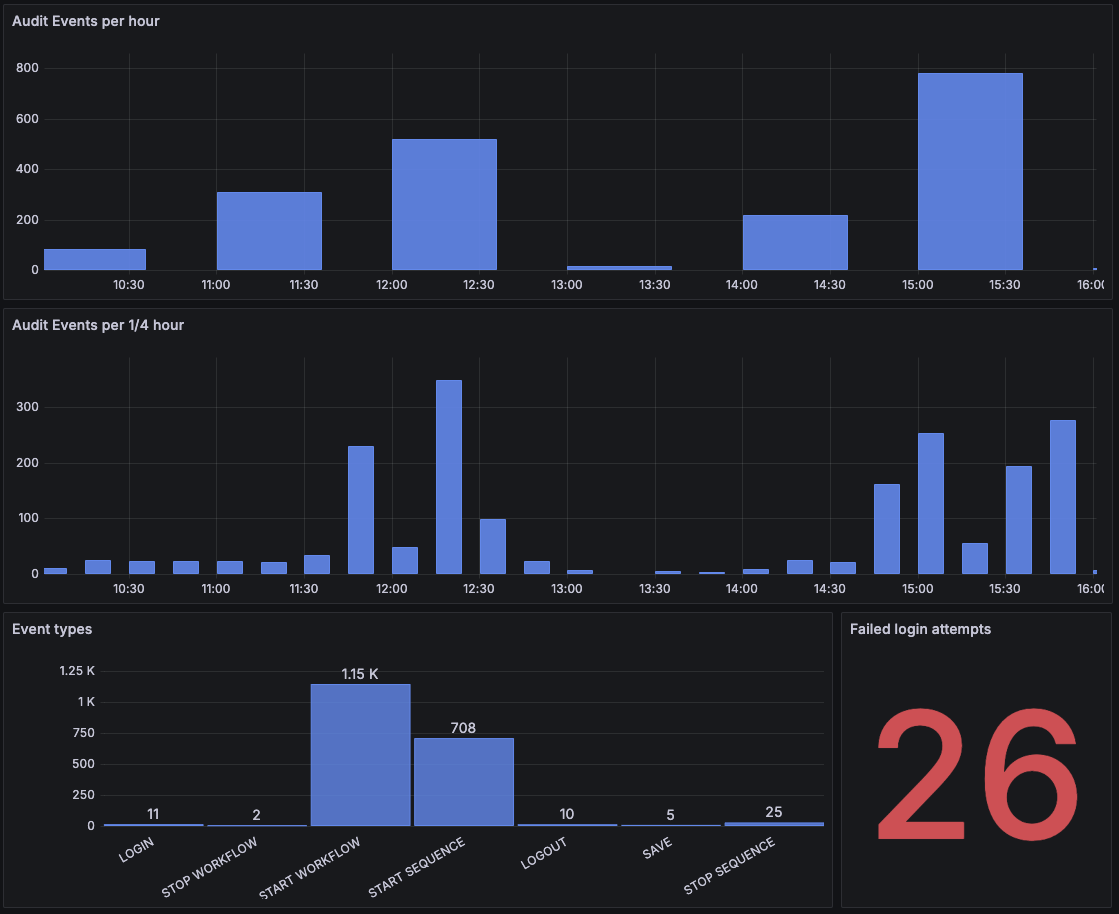
Here we are monitoring how many events happen and which ones in a selected time filter (i.e. : Last 6 hours).
In this example you can see two visualizations named Audit events per hour and per 1/4 hour. To obtain the data used by these dashboards you will need to use this SQL command in Grafana:
SELECT
  $__timeGroupAlias("event_when", 1h),
  count(id) AS "events"
FROM
  ait_factory_ait_event_audit
WHERE
  $__timeFilter(event_when)
GROUP BY
  1
ORDER BY
  1
PostgreSQL equivalent of this command :
SELECT
  EXTRACT(EPOCH FROM event_when) / 3600 * 3600 AS time,
  count(id) AS events
FROM
  ait_factory_ait_event_audit
WHERE
  event_when >= NOW() - INTERVAL '6 HOUR'
GROUP BY
  1
ORDER BY
  1;
For the 1/4 hour version you might want to replace the "1h" at line 2 by "15m", or anything else if you don't find these time ranges suit your needs.
Right below those two you can see a bar graph and a stat visualization called Event types and Failed login attempts. On the first one we use a combination of this SQL command :
SELECT
  id,
  event_type
FROM
  ait_factory_ait_event_audit
WHERE
  (
    $__timeFilter(event_when)
    AND event_type <> 'LOGIN FAIL'
  )
and a Transform data :

PostgreSQL equivalent of this :
SELECT
  event_type,
  COUNT(*) AS event_count
FROM
  ait_factory_ait_event_audit
WHERE
  event_when >= NOW() - INTERVAL '6 HOUR'
  AND event_type <> 'LOGIN FAIL'
GROUP BY
  event_type
In Failed login attempts we only count one type of event to count them apart from the graph which we thought might be useful in this case. Using this SQL command you can achieve the same result :
SELECT
  COUNT(id)
FROM
  ait_factory_ait_event_audit
WHERE
  (
    event_type = 'LOGIN FAIL'
    AND $__timeFilter(event_when)
  )
PostgreSQL equivalent of this command :
SELECT
  count(id)
FROM
  ait_factory_ait_event_audit
WHERE
  event_when >= NOW() - INTERVAL '6 HOUR'
  AND event_type = 'LOGIN FAIL';
Nodes and metrics

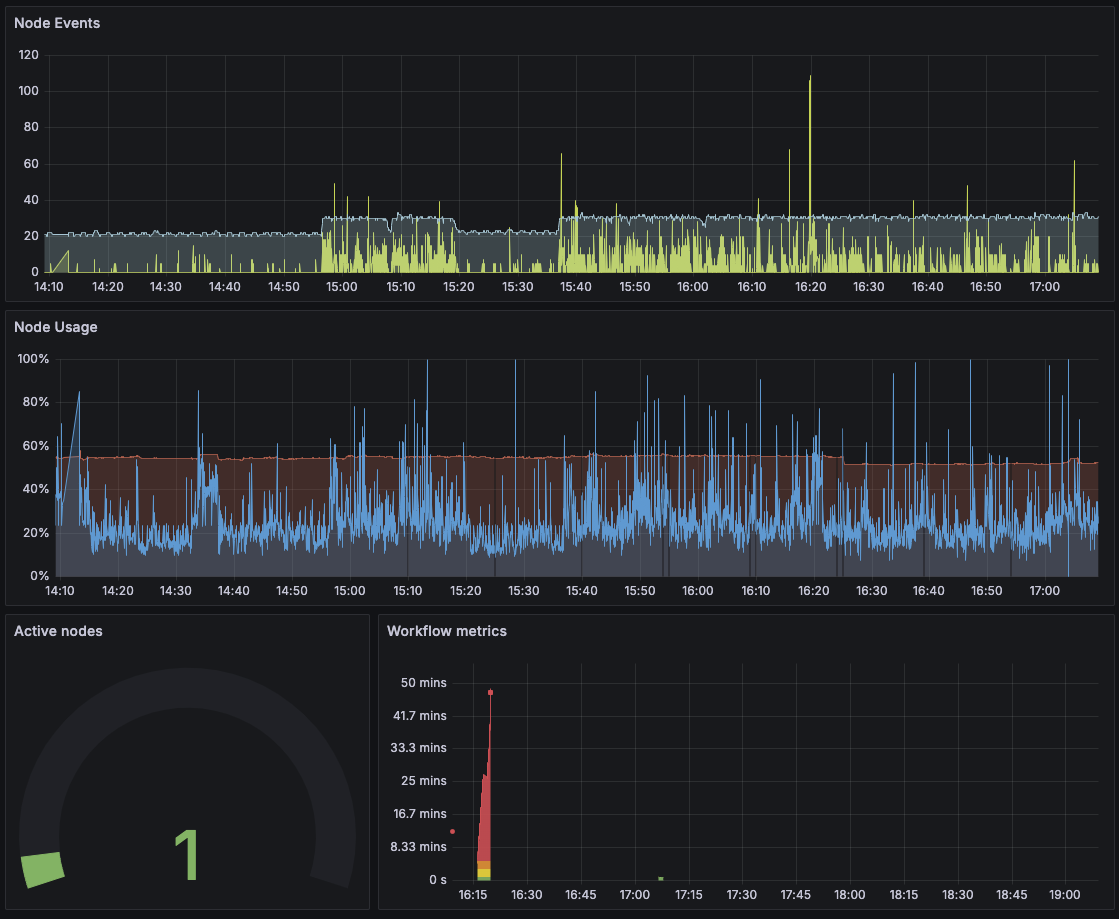
Here we are monitoring the events and the usage of a node, we also count active nodes and metrics. Everything is shown within the time filter of the dashboard except for active nodes which is the current value. The first panel shows the number of running workflows and events of the node with the ID 6 using this SQL command :
SELECT
  nos_events_count,
  nos_running_workflows,
  nos_datetime
FROM
  ait_factory_ait_nodestats
WHERE
  node_id = 6
The second panel shows the CPU and memory usage of the node using this SQL command :
SELECT
  nos_memory_percent,
  nos_cpu_percent,
  nos_datetime
FROM
  ait_factory_ait_nodestats
ORDER BY
  id DESC
In the Active nodes panel we are using this SQL command :
SELECT
  COUNT(id)
FROM
  ait_factory_ait_node
WHERE
  (
    node_active = true
    AND COALESCE(node_setup_build, '') <> ''
    AND node_last_active >= NOW() - INTERVAL '30 seconds'
  )
In the last panel we monitor the metrics of a workflow named "Workflow 1", using the SQL command below, you can replace it with the name of the workflow you want or replace "met_name" with "metric_template_id" and filter the query using that :
SELECT
  met_exec_delta AS "value",
  met_exec_start AS "time"
FROM
  ait_factory_ait_metric
WHERE
  met_name = 'Workflow'
Sequences and workflows

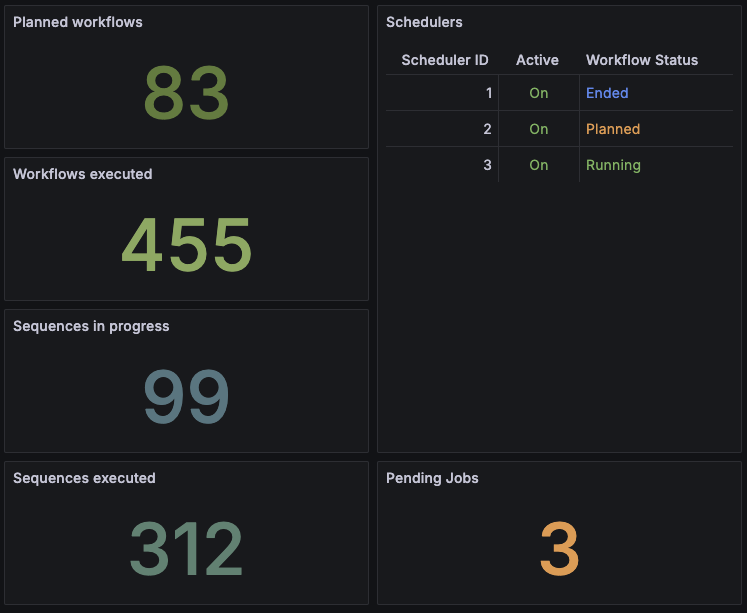
Here we monitor the state of the schedulers and with a series of simple queries we count the number of planned and executed workflows, the amount of sequences that are in progress, the amount that have been executed, and we also monitor the amount of pending jobs.
Planned workflows :
SELECT COUNT(id) FROM ait_factory_ait_workflowplannedinstance
Executed workflows :
SELECT COUNT(id) FROM ait_factory_ait_workflowinstance WHERE $__timeFilter(wfi_last_activity)
PostgreSQL equivalent of this command :
SELECT COUNT(id) FROM ait_factory_ait_workflowinstance WHERE wfi_last_activity >= NOW() - INTERVAL '6 HOUR'
Sequences in progress :
SELECT COUNT(id) FROM ait_factory_ait_sequence WHERE seq_state = 'IN_PROGRESS'
Executed sequences :
SELECT COUNT(id) FROM ait_factory_ait_sequence WHERE $__timeFilter(seq_end_date)
PostgreSQL equivalent of this command :
SELECT COUNT(id) FROM ait_factory_ait_sequence WHERE seq_end_date >= NOW() - INTERVAL '6 HOUR'
Pending jobs :
SELECT COUNT(id) FROM ait_factory_ait_joballocation WHERE jol_state = 'WAITING_RESPONSE'
To monitor the schedulers we are going to need something a bit more elaborated :
SELECT
  ws.id AS scheduler_id,
  ws.active,
  wi.wfi_status
FROM
  ait_factory_ait_workflowscheduler ws
  INNER JOIN ait_factory_ait_workflowinstance wi ON ws.workflow_instance_id = wi.id
ORDER BY
  wi.id DESC
Database

Here we are monitoring the size of the database and its tables, granted this isn't something exclusive to Pulse-IT/Automate-IT, but we felt it is a useful dashboard and including it doesn't hurt. On the left panel we are displaying the result of this SQL command and setting the unit of the panel as bytes :
SELECT pg_size_pretty(pg_database_size('ait_factory')) AS mydbsize;
On the right panel we detail the size of the ten biggest tables using this SQL command :
SELECT
  relname AS "table_name",
  pg_table_size(C.oid) AS "table_size"
FROM
  pg_class C
  LEFT JOIN pg_namespace N ON (N.oid = C.relnamespace)
WHERE
  nspname NOT IN ('pg_catalog', 'information_schema')
  AND nspname !~ '^pg_toast'
  AND relkind IN ('r')
ORDER BY
  pg_table_size(C.oid) DESC
LIMIT
  10;